Fresh thinking for
growing businesses.
Ideas, practical guides and lessons on connecting sales, improving customer relationships and building systems that grow revenue.
Data & reporting
How to Build Reports That Drive Revenue Decisions
· 12 min read
Business decisions based on gut feelings instead of data cost companies millions in lost revenue every year. When you build reports that accurately capture your sales pipeline, customer journey, and revenue metrics, you gain the clarity needed to make confident strategic moves. For HubSpot users, the reporting framework offers powerful capabilities, but many businesses struggle to create reports that truly inform decision-making rather than just displaying numbers.
Understanding the Foundation of Effective Revenue Reporting
Before you build reports, you need clean, structured data as your foundation. HubSpot's reporting engine can only deliver insights as good as the data feeding into it. This means establishing consistent property definitions, standardizing how your team logs activities, and ensuring pipeline stages reflect actual business processes.
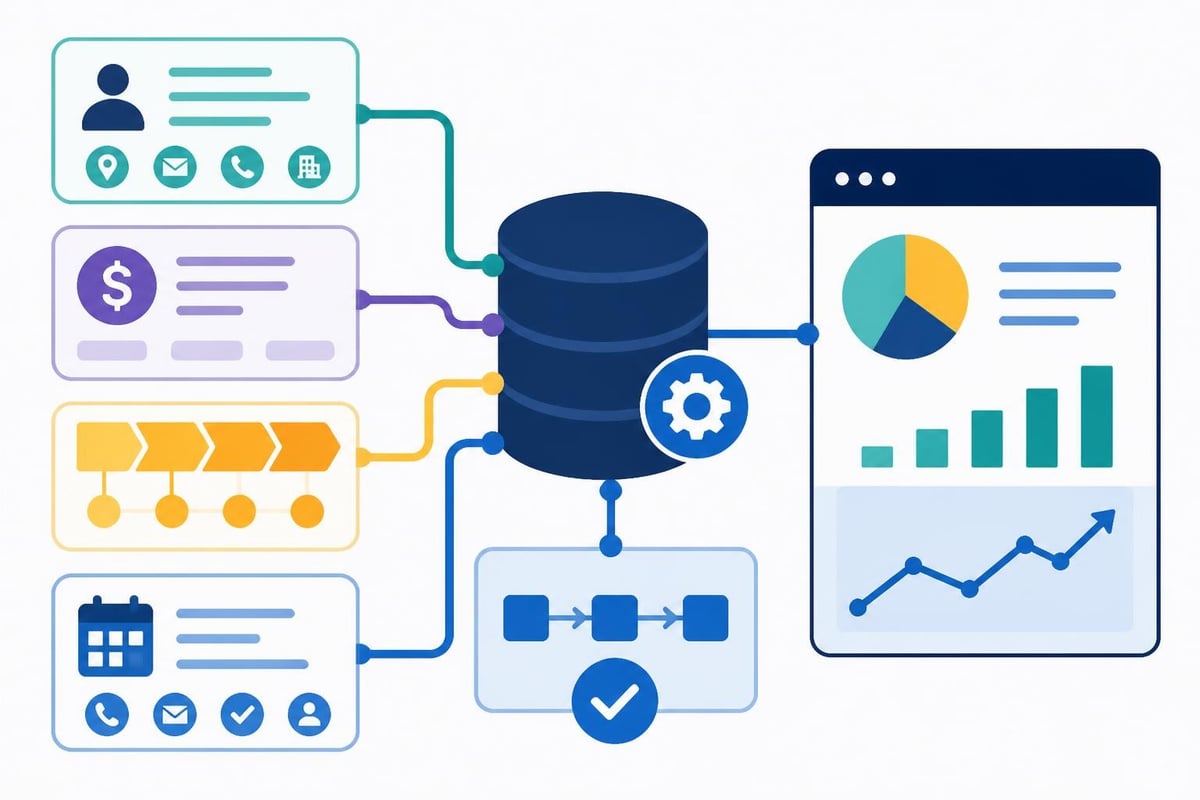
Revenue reporting requires alignment across three critical data streams: contact and company information, deal progression through your pipeline, and activity tracking from your sales and marketing teams. When these streams connect properly, you can build reports that answer questions about conversion rates, sales velocity, and revenue attribution.
The Role of Data Architecture in Report Building
Your CRM data model determines what reports you can create. Property mapping establishes which fields track deal values, close dates, deal stages, and owner assignments. Lifecycle stages define how contacts progress from stranger to customer. Pipeline customization ensures stages match your actual sales process.
Many businesses inherit poorly structured HubSpot portals where previous administrators created duplicate properties, used inconsistent naming conventions, or failed to establish required fields. Common CRM mistakes like these create reporting nightmares where data appears incomplete or contradictory.
Consider this data quality checklist before building revenue reports:
All deal stages have clear entry and exit criteria
Required properties are enforced for pipeline progression
Date stamps capture when deals move between stages
Revenue values are recorded in a single currency
Lost reasons are consistently categorized
Contact lifecycle stages sync with deal progression
Building Sales Performance Reports That Matter
Sales leaders need visibility into individual rep performance, team trends, and pipeline health. When you build reports for sales performance, focus on metrics that drive behavior rather than vanity numbers that look impressive but don't correlate with revenue.
Start with fundamental sales metrics: deals created by rep and time period, deals closed with win rates, average deal size, and sales cycle length. These core measurements establish baseline performance. Layer in activity metrics like calls made, emails sent, and meetings held to understand effort levels behind results.
Metric Category | Primary Metrics | Secondary Metrics | Decision Impact |
|---|---|---|---|
Pipeline Health | Total pipeline value, deals by stage | Weighted pipeline, stage velocity | Forecasting accuracy |
Rep Performance | Deals closed, revenue generated | Win rate, average deal size | Coaching priorities |
Activity Volume | Meetings held, calls made | Email response rates, touch frequency | Process adherence |
Sales Velocity | Average sales cycle, stage duration | Time to first meeting, follow-up speed | Resource allocation |
Configuring Pipeline Reports for Forecast Accuracy
Accurate revenue forecasting depends on understanding how deals progress through your pipeline. Build reports that track deal movement between stages, calculate weighted pipeline values based on stage probability, and identify where deals stall.
Time-based pipeline snapshots let you compare current pipeline against historical periods. Create monthly pipeline reports showing total value by stage, new deals added, deals advanced, and deals that moved backward or were lost. This progression analysis reveals bottlenecks in your sales process.
According to best practices for creating reports, simplifying data relationships improves report performance. In HubSpot, this means avoiding overly complex filters that query multiple object types when a simpler approach would work.
Build reports using deal-centric views when analyzing pipeline, then associate contact and company properties only when necessary. This approach loads faster and makes troubleshooting easier when numbers don't match expectations.
Creating Marketing Attribution and ROI Reports
Marketing teams need to prove ROI by connecting campaigns to revenue. When you build reports for marketing attribution, HubSpot's contact attribution models help track which touchpoints influenced deal creation and closure.
First-touch attribution credits the initial interaction that brought someone into your database. Last-touch attribution credits the final interaction before deal creation. Multi-touch attribution distributes credit across multiple interactions throughout the buyer journey.
The attribution model you choose affects how you measure campaign success:
Define your attribution window (how far back to credit interactions)
Select attribution models that align with your sales cycle
Build reports comparing campaign performance across models
Track influenced revenue versus directly created revenue
Calculate cost per acquisition and return on ad spend
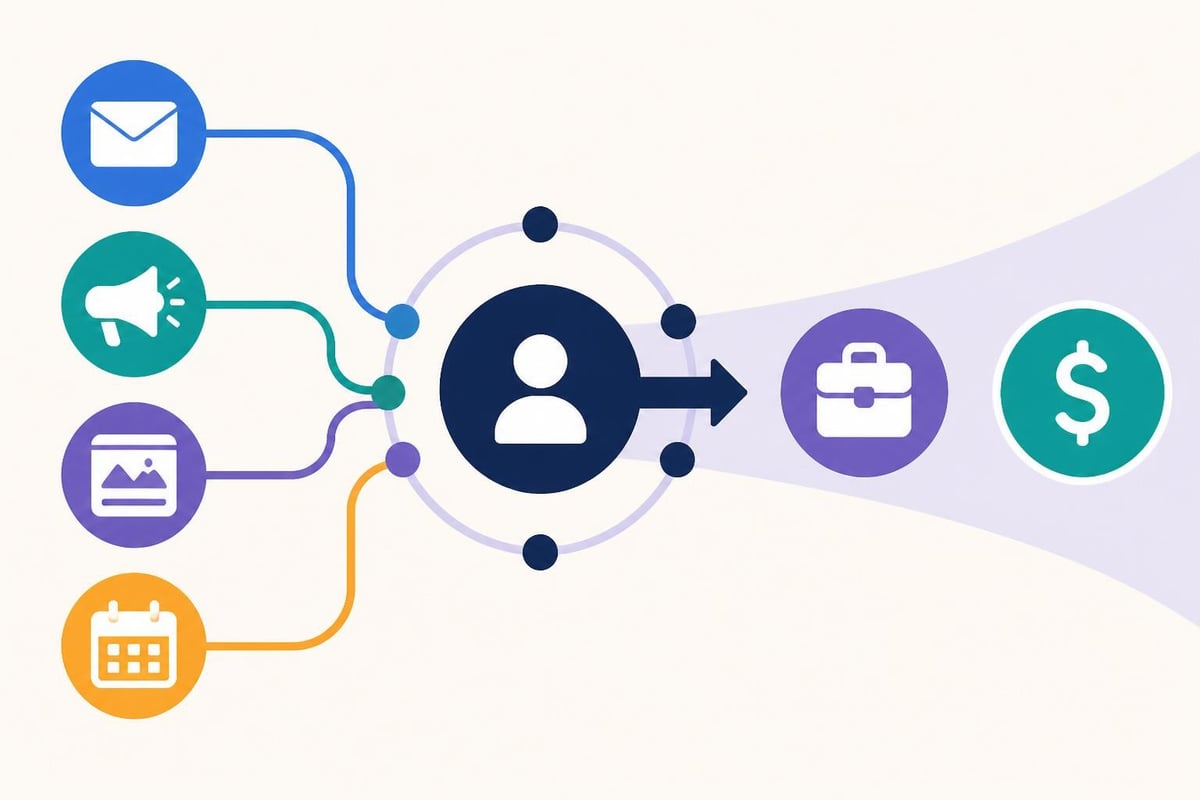
Marketing attribution becomes particularly valuable when integrated with sales pipeline data. A deal might originate from a paid search ad (first touch), engage with multiple email nurture sequences, and close after a webinar (last touch before opportunity). Understanding this journey helps allocate marketing budget effectively.
Connecting Campaign Performance to Revenue Outcomes
Build reports that connect specific campaigns to closed revenue, not just to leads generated. In HubSpot, this requires properly associating campaigns with contacts, ensuring contacts are associated with deals, and tracking deal progression to close.
Create custom reports showing campaign name, total spend, contacts generated, marketing qualified leads created, opportunities created, deals closed, and revenue generated. Calculate metrics like cost per opportunity and marketing-sourced revenue percentage.
Designing Customer Health and Retention Reports
For businesses with recurring revenue models, customer retention reports matter as much as new business reports. When you build reports tracking customer health, you create early warning systems for churn risk and identify expansion opportunities.
Key retention metrics include renewal rate, customer lifetime value, net revenue retention, and expansion revenue. These measurements require tracking customer start dates, contract values, renewal dates, and upsell activities within HubSpot deals.
Build reports segmenting customers by cohort (when they started), product tier, contract value, and health score. Compare retention rates across segments to identify which customer profiles retain best and which require intervention.
Implementing Health Score Tracking
Customer health scores combine engagement metrics, product usage data, support ticket volume, and payment history into a single indicator. While HubSpot doesn't natively track product usage, you can integrate this data through custom HubSpot integrations or use calculated properties based on CRM activities.
Create health score reports showing distribution of accounts across healthy, at-risk, and critical categories. Build filtered views showing accounts that deteriorated in health over the past 30 days, triggering proactive outreach from customer success teams.
Automating Report Distribution and Alerts
Reports deliver value when the right people see them at the right time. Manual report checking wastes time and leads to delayed responses to important trends. Build reports once, then automate delivery through HubSpot's scheduled report emails and dashboard sharing.
Configure daily pipeline reports for sales leaders showing overnight changes. Set weekly performance summaries for individual reps. Create monthly executive dashboards with high-level revenue trends and year-over-year comparisons.
Beyond scheduled reports, set up threshold alerts that notify teams when metrics exceed boundaries. Alert sales managers when pipeline drops below target levels. Notify marketing when cost per lead exceeds budget thresholds. Trigger customer success outreach when health scores fall below acceptable ranges.
The OpenMRS best practices guide emphasizes thorough documentation when creating reports. In HubSpot, document report purposes, filter logic, and intended audiences in report descriptions. This documentation helps when team members transition or when you need to troubleshoot unexpected results.
Advanced Reporting Techniques for Complex Business Models
Standard HubSpot reports handle most business needs, but complex revenue models require creative approaches. Multi-stage sales processes, partnership revenue splits, and commission tracking demand custom solutions.
Calculated properties enable custom metrics not available in standard fields. Create properties that calculate days in current stage, deal age, or discount percentages. Use workflow automation to update these properties as deals progress.
Custom objects extend HubSpot's data model for unique business requirements. If you track projects, assets, or other entities beyond standard contacts, companies, deals, and tickets, custom objects let you build reports around these records.
Building Multi-Currency Revenue Reports
International businesses face challenges when building reports across multiple currencies. HubSpot supports multi-currency deals, but reporting requires careful consideration of exchange rate timing and conversion approaches.
Build reports using company currency for operational decisions (what did we actually receive?) and standardized currency for consolidated reporting (how do all regions compare?). Document which exchange rates you use and when conversions occur.
According to reporting best practices from Adobe Workfront, using report prompts allows users to customize outputs without creating dozens of similar reports. In HubSpot, filters with selectable date ranges, owners, or deal properties serve this purpose.

Optimizing Report Performance and Usability
Slow-loading reports frustrate users and reduce adoption. When you build reports with thousands of records and complex filters, performance matters. HubSpot's reporting engine processes queries differently based on report complexity.
Reduce report load times by limiting date ranges to relevant periods, using indexed properties in filters when possible, and avoiding unnecessary property columns. If a report takes more than five seconds to load, consider whether you're querying too much data or using inefficient filter combinations.
Report organization impacts usability as much as performance. Create folder structures that match how teams think about data: pipeline reports, marketing reports, customer success reports. Name reports descriptively, including the metric, time frame, and filter criteria.
Many teams benefit from working with freelance marketing and sales specialists who can optimize reporting structures. Platforms like Markkinointikone connect businesses with freelancers experienced in CRM reporting and sales process optimization.
Creating User-Friendly Dashboards
Dashboards aggregate multiple reports into single views, but poorly designed dashboards overwhelm rather than inform. When building dashboards, follow these principles:
Limit dashboards to 6-8 reports maximum
Place the most important metric in the top-left position
Use consistent date ranges across related reports
Choose visualization types that match data types
Include context through comparison periods or targets
Build role-specific dashboards rather than one-size-fits-all views. Sales reps need different information than sales leaders. Marketing managers require different metrics than executives. Create dashboards tailored to each audience's decision-making needs.
Integrating External Data Sources
HubSpot reporting becomes more powerful when connected to external systems. Financial data from accounting software, product usage from application databases, and advertising performance from platforms like Google and Facebook create comprehensive business intelligence.
Native HubSpot integrations handle common connections, but complex data synchronization requires custom integration work that ensures bidirectional data flow and maintains data integrity. When building reports that depend on integrated data, verify sync frequency and troubleshoot discrepancies between systems.
For eCommerce businesses using platforms like Shopify, connecting sales data to HubSpot enables customer lifecycle reporting that spans marketing acquisition through post-purchase engagement. Communities like Talk Shop offer insights into integrating eCommerce platforms with CRM systems for better reporting.
The BrowserStack guide to build tools discusses automation in software development, but the principles apply to report building: automate repetitive tasks, standardize processes, and reduce manual errors through systematic approaches.
Governance and Report Maintenance
Reports require ongoing maintenance as business processes evolve. Pipeline stages change, new properties get added, and team structures shift. Without governance, report libraries become cluttered with outdated, duplicate, or broken reports.
Establish report ownership assigning specific team members responsibility for maintaining key reports. Schedule quarterly reviews of all reports, archiving those no longer used and updating filters for current business logic.
Version control for reports prevents confusion when multiple people modify the same report. Before changing a widely used report, duplicate it and test modifications on the copy. Document changes in report descriptions, noting what changed and why.
When team members leave or roles change, audit which reports they owned and reassign maintenance responsibilities. Nothing undermines reporting credibility faster than broken reports that nobody maintains.
Training Teams on Report Interpretation
Building powerful reports accomplishes nothing if teams don't understand what the numbers mean. Invest time training people on metric definitions, how to filter reports, and which actions to take based on results.
Create documentation explaining each standard report: what it measures, who should use it, how often to review it, and what constitutes good versus concerning performance. Record training videos walking through key dashboards and their interpretation.
For businesses implementing structured sales processes, reporting training should align with process training. Teams need to understand how their activities flow through the CRM and appear in performance reports.
Microsoft's reporting guidelines emphasize providing context in reports. In practice, this means including benchmark comparisons, trend indicators, and thresholds that signal when action is needed.
Scaling Reporting for Growing Organizations
As businesses grow, reporting needs evolve from basic pipeline tracking to sophisticated revenue operations intelligence. When you build reports for a five-person sales team, simple approaches work. At fifty people across multiple teams and regions, you need structured reporting frameworks.
Enterprise reporting requires standardized metrics across teams, consolidated views that roll up regional performance, and drill-down capabilities that let leaders investigate anomalies. Build hierarchical reports that executives view at high levels while individual contributors access detailed activity data.
Consider implementing RevOps strategy that aligns reporting across sales, marketing, and customer success. RevOps ensures everyone measures success consistently and reports connect the full customer lifecycle from first touch to renewal.
According to Power BI best practices for paginated reports, precise layouts and automated distribution become critical at scale. While HubSpot isn't Power BI, the same principles apply: consistent formatting, reliable scheduling, and parameter-driven customization improve adoption.
Building reports that transform CRM data into actionable revenue intelligence requires strategic thinking about data architecture, metric selection, and user needs. When you build reports properly in HubSpot, you create visibility that drives better decisions across sales, marketing, and customer success teams. Revio helps businesses implement revenue reporting systems that combine clean data foundations, automated workflows, and dashboards executives trust, ensuring your HubSpot portal delivers the insights needed to scale efficiently.
Put good ideas to work in your business.
We build practical AI systems around your customers, your team and the work that helps your business grow.