Fresh thinking for
growing businesses.
Ideas, practical guides and lessons from building brands, connecting systems and putting AI to work.
HubSpot
Pipeline Reporting: A Complete Guide for Revenue Teams
· 4 min read
Revenue teams operate in a data-rich environment where every decision impacts the bottom line. Without clear visibility into deal progression, conversion rates, and revenue forecasts, businesses struggle to identify bottlenecks, allocate resources effectively, and predict future performance. Pipeline reporting transforms raw CRM data into actionable intelligence, enabling sales leaders, marketing teams, and executives to make informed strategic decisions that drive sustainable growth.
Understanding Pipeline Reporting Fundamentals
Pipeline reporting is the systematic process of tracking, analyzing, and presenting data about opportunities as they move through defined sales stages. This practice provides real-time visibility into deal health, revenue projections, and team performance metrics that directly influence business outcomes.
At its core, effective reporting requires accurate data capture at every stage of the customer journey. Each deal must be properly categorized, timestamped, and attributed to ensure downstream analysis reflects reality rather than assumptions.
Core Components of Effective Reporting
A robust reporting framework includes several essential elements that work together to provide comprehensive pipeline visibility:
Stage-by-stage progression tracking that monitors how deals advance through your sales process
Time-based metrics including average deal cycle length and stage duration
Value calculations showing total pipeline value, weighted forecasts, and expected close dates
Conversion rate analysis measuring how effectively opportunities move between stages
Team and individual performance metrics comparing quota attainment and activity levels
The foundation of accurate reporting begins with clean, well-structured CRM data. Property fields must be consistently populated, deal stages clearly defined, and ownership properly assigned. Without this groundwork, even sophisticated reporting tools produce misleading insights.

Distinguishing Pipeline Metrics from Other Analytics
Understanding what makes pipeline reporting distinct from other business intelligence activities helps teams focus their efforts appropriately. While general analytics might track website traffic or marketing engagement, pipeline metrics specifically measure revenue-generating activities and deal progression.
Metric Type | Pipeline Reporting | General Analytics |
|---|---|---|
Primary Focus | Deal progression and revenue forecasting | Broad business performance indicators |
Time Horizon | Current quarter and immediate future | Historical trends and long-term patterns |
Key Stakeholders | Sales leaders, revenue operations, executives | Marketing, product, operations teams |
Update Frequency | Daily or real-time | Weekly or monthly |
This distinction matters because pipeline reporting demands higher data accuracy and more frequent updates than many other reporting types. A marketing report showing last month's website traffic can afford minor discrepancies, but a pipeline forecast informing hiring decisions or investor communications requires precision.
Essential Metrics for Revenue Visibility
Understanding which metrics actually matter separates productive reporting from data noise. Revenue teams often track dozens of data points, but only a subset truly drives decision-making and strategic planning.
Velocity and Conversion Fundamentals
Pipeline velocity measures how quickly deals move from initial contact to closed-won status. This compound metric incorporates four critical variables: number of opportunities, average deal value, win rate, and sales cycle length. Together, these factors determine revenue generation speed.
Conversion rates at each stage reveal where your process excels and where prospects stall. A healthy pipeline shows consistent conversion percentages between stages, while dramatic drop-offs indicate specific problems requiring attention.
Average deal size provides context for resource allocation decisions. Pursuing small opportunities with the same intensity as enterprise deals wastes valuable selling time and distorts forecasting accuracy.
Coverage Ratios and Forecast Accuracy
Pipeline coverage ratio compares total pipeline value to quota or revenue targets. Most organizations aim for 3-4x coverage, meaning pipeline value should be three to four times the revenue goal. This buffer accounts for natural deal attrition and conversion inefficiencies.
Forecast accuracy measures how closely predicted revenue matches actual closed deals. Teams typically track this across multiple time horizons:
Current week forecast (should exceed 90% accuracy)
Current month projection (target 80-85% accuracy)
Current quarter outlook (aim for 70-75% accuracy)
Next quarter forecast (typically 50-60% accuracy in early weeks)
Win rate by source helps marketing and sales teams understand which lead generation channels produce the highest-quality opportunities. A channel generating high volume but low conversion rates may need qualification improvements rather than increased investment.
Building Reports That Drive Action
Creating reports that actually influence behavior requires more than assembling data visualizations. Effective pipeline reporting connects directly to how teams work and what decisions they need to make.
Designing Reports for Different Audiences
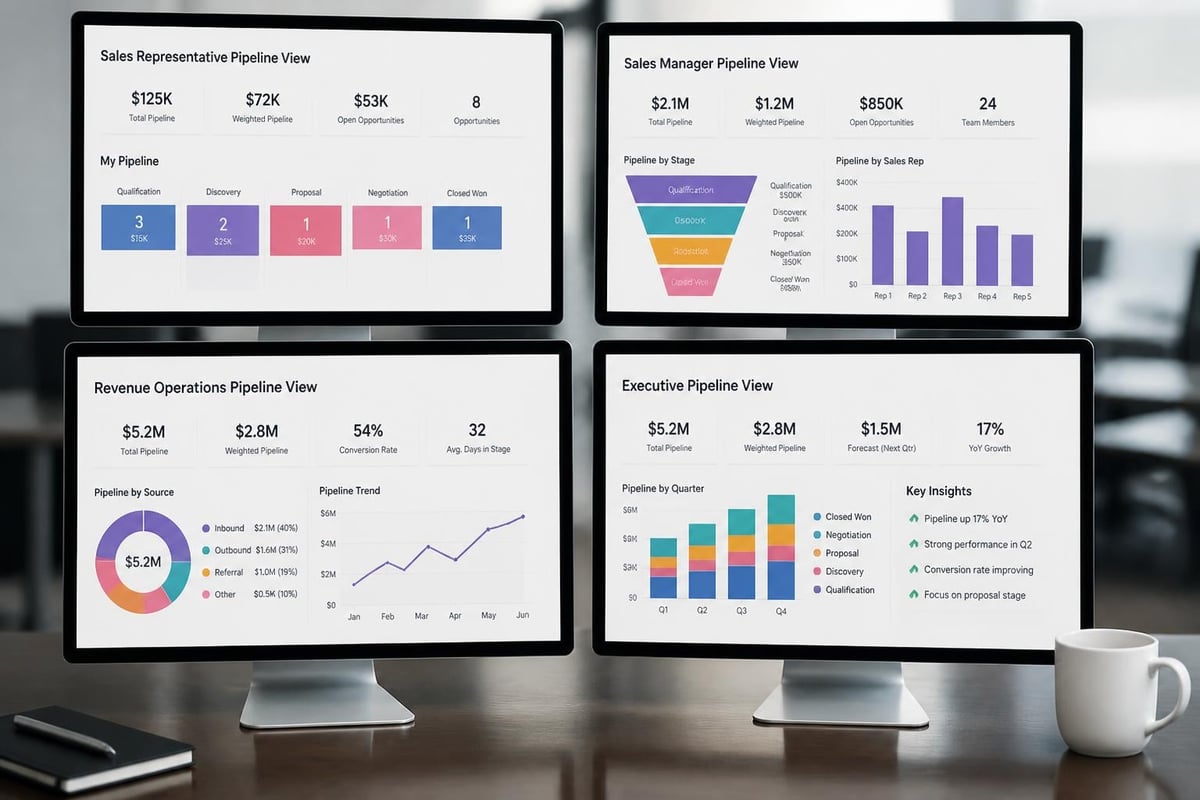
Sales representatives need daily visibility into their individual pipelines, including which deals require immediate attention and what actions will advance opportunities. These reports should highlight upcoming close dates, stalled deals, and required next steps.
Sales managers require team-level aggregations showing overall health, individual performance comparisons, and resource allocation opportunities. Their reports should surface underperformers needing coaching and top performers whose techniques can be replicated.
Executive dashboards focus on high-level trends, forecast reliability, and strategic metrics like customer acquisition cost and lifetime value. These stakeholders need context more than granular detail, with clear visualizations that communicate status at a glance.
According to best practices for sales pipeline reporting, matching report complexity to audience needs prevents information overload while ensuring each role receives actionable intelligence.
Audience | Report Frequency | Key Metrics | Primary Use Case |
|---|---|---|---|
Sales Reps | Daily | Individual pipeline value, next actions, at-risk deals | Deal execution and prioritization |
Sales Managers | Weekly | Team quota attainment, stage distribution, velocity trends | Coaching and resource allocation |
Revenue Operations | Weekly | Data quality scores, process compliance, conversion rates | System optimization and training needs |
Executives | Monthly | Forecast accuracy, overall pipeline health, revenue trends | Strategic planning and investor communications |
Technical Implementation Strategies
Modern CRM platforms like HubSpot provide native reporting capabilities that handle most pipeline analysis needs. The key is building reports with proper filters, date ranges, and groupings that reflect your actual sales process.
Custom properties enable tracking of business-specific data points that standard CRM fields don't capture. These might include deal complexity scores, competitor presence indicators, or custom stage progression timestamps that power advanced velocity calculations.
For organizations requiring sophisticated analysis beyond native CRM capabilities, HubSpot Integrations enable bidirectional data flows with analytics platforms, data warehouses, and business intelligence tools. These integrations maintain data consistency across systems while enabling advanced segmentation and predictive modeling that inform strategic planning.
Dashboard automation ensures stakeholders receive timely updates without manual report generation. Scheduled emails, Slack notifications, or mobile alerts keep teams informed of critical changes requiring immediate attention.
Maintaining Data Quality for Accurate Insights
Pipeline reporting accuracy depends entirely on underlying data quality. Even the most sophisticated analysis produces misleading conclusions when built on incomplete or incorrect information.
Establishing Data Governance Standards
Clear field definitions prevent inconsistent data entry that undermines reporting accuracy. Every team member must understand exactly what constitutes each deal stage, how to populate required fields, and when to update opportunity records.
Required fields enforce minimum data standards by preventing deal progression without essential information. Configure your CRM to demand key details like expected close date, deal value, and decision-maker contact before advancing opportunities to later stages.
Regular data audits identify systematic issues requiring process improvements. Monthly reviews should check for missing required fields, stale opportunities without recent activity, and stage distributions that don't match expected patterns.
Common Data Quality Challenges
Several recurring problems plague pipeline data quality across organizations:
Deals stuck in early stages for extended periods without activity updates
Inconsistent stage usage where reps skip stages or advance deals prematurely
Missing or outdated contact information preventing accurate attribution
Duplicate records that inflate pipeline value and distort conversion calculations
Incorrect close dates that mislead forecasting and resource planning
Addressing these issues requires both technology solutions and cultural changes. Automated workflows can flag problematic records, while regular training ensures teams understand why data quality matters and how their inputs affect business decisions.
According to guidance on RevOps reporting best practices, establishing shared definitions across teams prevents the data inconsistencies that undermine cross-functional collaboration and strategic alignment.
Advanced Reporting Techniques for 2026
As CRM capabilities evolve and data volumes increase, sophisticated reporting techniques provide competitive advantages for forward-thinking revenue teams.
Predictive Analytics and AI-Powered Insights
Machine learning models analyze historical pipeline data to predict deal outcomes with increasing accuracy. These algorithms identify patterns human analysts might miss, flagging at-risk opportunities before traditional indicators appear.
AI-powered lead scoring incorporates pipeline performance data to refine qualification models continuously. By analyzing which characteristics correlate with closed-won outcomes, these systems help sales teams prioritize efforts toward highest-probability opportunities.
Sentiment analysis tools process email communications and meeting transcripts to assess deal health beyond manual stage updates. These insights provide early warning of deteriorating relationships or emerging objections requiring intervention.
Multi-Touch Attribution and Revenue Tracking
Understanding which marketing activities actually contribute to closed revenue requires sophisticated attribution modeling. Pipeline reporting increasingly incorporates multi-touch attribution that credits all influencing touchpoints rather than assigning full value to first or last interactions.
Integration with marketing automation platforms creates closed-loop reporting showing how campaigns influence pipeline creation, progression, and conversion. This visibility enables data-driven budget allocation decisions based on actual revenue impact rather than vanity metrics.
Revenue operations teams should track essential RevOps metrics that connect marketing spend to pipeline value to closed revenue, creating accountability across the entire revenue generation process.

Optimizing Reports for Strategic Decision-Making
The ultimate purpose of pipeline reporting extends beyond status updates to enabling better strategic decisions that improve business outcomes.
Identifying Bottlenecks and Process Improvements
Stage duration analysis reveals where deals typically stall, indicating process inefficiencies or resource constraints. If opportunities consistently spend three weeks in technical validation, your team may need additional pre-sales engineering support.
Conversion rate variance by deal characteristic helps identify winning patterns worth replicating. Perhaps opportunities sourced from partner referrals convert 40% more often than cold outbound, suggesting resource reallocation opportunities.
Loss analysis categorizes why deals fail, distinguishing between controllable factors like pricing or features and external circumstances like budget cuts or competitive wins. This intelligence informs product roadmap decisions and competitive positioning strategies.
Capacity Planning and Quota Setting
Accurate pipeline reporting enables realistic capacity planning based on actual team performance rather than aspirational targets. By analyzing how many opportunities each representative effectively manages and historical conversion rates, leaders can set achievable quotas that motivate rather than demoralize.
Hiring decisions benefit from pipeline velocity calculations showing how quickly current team capacity will reach limits. If pipeline growth outpaces closed-won rates, expanding the sales team becomes urgent rather than optional.
Territory design optimization uses pipeline distribution data to ensure balanced opportunity allocation across representatives. Significant imbalances in pipeline value or deal count between territories indicate need for realignment.
Many organizations leverage Salesforce pipeline inspection metrics as models for comprehensive tracking frameworks, though these principles apply across any modern CRM platform.
Integration with Broader Business Systems
Pipeline reporting delivers maximum value when connected to other business intelligence systems, creating unified visibility across operations.
Financial Planning Connections
Finance teams rely on pipeline forecasts for cash flow projections, expense planning, and investor communications. Establishing regular data exchange between CRM and financial planning systems ensures alignment between revenue expectations and operational spending.
Revenue recognition timing depends on accurate close date forecasting from pipeline data. Discrepancies between projected and actual close dates create financial reporting challenges and potential compliance issues for public companies.
Quota versus pipeline coverage comparisons inform commission structure decisions and incentive program design. If coverage ratios consistently exceed targets, organizations might consider more aggressive quota assignments or revised compensation plans.
Customer Success and Retention Tracking
Pipeline reporting shouldn't end at deal closure. Expansion opportunities, renewal probabilities, and churn risk indicators create post-sale pipelines requiring similar rigor to new business tracking.
Expansion pipeline reporting tracks upsell and cross-sell opportunities within existing accounts, often showing faster sales cycles and higher win rates than new logo acquisition. These metrics justify customer success investments and account management resources.
Churn prediction models use engagement data, support ticket volume, and contract renewal timing to identify at-risk accounts requiring intervention. Incorporating these insights into executive dashboards ensures retention receives appropriate strategic attention.
For teams managing complex data environments, resources on building robust data pipelines provide architectural guidance ensuring scalability as reporting requirements grow.
Real-World Implementation Challenges
Implementing effective pipeline reporting rarely proceeds smoothly. Understanding common obstacles helps teams anticipate and address issues before they derail projects.
Change Management and User Adoption
Sales representatives often resist additional data entry requirements, viewing them as administrative burden that reduces selling time. Successful implementations clearly communicate how improved reporting directly benefits individual contributors through better territory assignments, more accurate commission calculations, and easier deal prioritization.
Gradual rollouts prove more effective than big-bang implementations. Start with essential fields and basic reports, then expand functionality as teams develop comfort and see value from initial efforts.
Executive sponsorship signals organizational commitment and ensures adequate resources for training, system configuration, and ongoing support. Without visible leadership backing, pipeline reporting initiatives often stagnate when competing priorities emerge.
Technical Complexity and System Limitations
Legacy CRM systems may lack native reporting capabilities required for sophisticated analysis, necessitating custom development or third-party tools. Evaluate whether platform limitations justify migration investments versus workarounds.
Data volume challenges emerge as organizations scale, with report generation times increasing and dashboard performance degrading. Optimizing queries, archiving old data, and implementing caching strategies address these issues without requiring complete system overhauls.
Integration complexity increases with each connected system, creating maintenance burden and potential failure points. Prioritize integrations delivering clear value rather than connecting everything possible simply because APIs exist.
Establishing Reporting Cadences and Rituals
Consistent reporting rhythms create accountability and ensure insights actually influence decisions rather than gathering dust in dashboards nobody views.
Weekly Pipeline Reviews
Sales team meetings should center on pipeline health, with each representative presenting their forecast, highlighting at-risk deals, and requesting help with specific opportunities. These sessions identify coaching needs and facilitate knowledge sharing around effective techniques.
Standard agenda structures ensure productive discussions rather than unfocused rambling:
Review forecast changes since last meeting and explain variances
Discuss new opportunities added to pipeline this week
Identify deals requiring manager intervention or cross-functional support
Celebrate wins and analyze why those deals succeeded
Address data quality issues and process compliance gaps
Recording action items and following up on commitments maintains accountability between meetings. Deals flagged as needing attention one week should show progress the next, or explanations why circumstances changed.
Monthly Business Reviews
Executive leadership reviews should examine trends over longer timeframes, identifying strategic patterns rather than tactical deal details. Month-over-month and year-over-year comparisons reveal whether pipeline health is improving or deteriorating.
Forecast accuracy tracking over multiple months highlights whether prediction quality improves as teams refine their processes. Consistent overforecasting or underforecasting indicates systematic biases requiring correction.
Conversion rate trends by stage reveal whether process changes produce intended improvements. If a new qualification framework was implemented, subsequent conversion rates should increase as lower-quality opportunities get filtered earlier.
Organizations can learn from approaches detailed in pipeline monitoring best practices which emphasize regular health checks and automated alerting for anomalies, though applied to sales contexts rather than technical systems.
Future Trends Shaping Pipeline Reporting
The pipeline reporting landscape continues evolving as technology capabilities expand and business expectations increase. Forward-thinking organizations are already adopting emerging practices that will become standard in coming years.
Real-Time Collaboration and Deal Rooms
Traditional pipeline reviews occur weekly or monthly, but modern tools enable continuous collaboration around specific opportunities. Deal rooms aggregate all relevant information about an opportunity in one location, automatically updating stakeholders as situations evolve.
Asynchronous updates reduce meeting burden while maintaining alignment. Instead of waiting for weekly reviews to surface issues, automated alerts notify managers immediately when deals stall or unexpected changes occur.
Integration with communication platforms like Slack or Microsoft Teams brings pipeline data into workflows where teams already operate, rather than requiring separate logins to specialized reporting tools.
Prescriptive Recommendations Beyond Descriptive Analytics
Most pipeline reporting remains descriptive, showing what happened without suggesting what to do about it. The next generation provides prescriptive guidance recommending specific actions likely to improve outcomes.
Next-best-action suggestions analyze deal characteristics, historical patterns, and current stage to recommend whether representatives should schedule additional discovery calls, involve executives, adjust pricing, or request technical resources.
Automated playbook recommendations trigger based on deal attributes, suggesting proven approaches for specific scenarios. When an opportunity matches patterns associated with competitive displacement wins, the system surfaces relevant case studies and competitive battle cards.
These capabilities rely on sophisticated AI models trained on historical outcome data, learning which actions correlate with success in various contexts. Teams interested in exploring these possibilities should investigate how to build a sales process that supports data-driven decision-making.
Effective pipeline reporting transforms how revenue teams operate, replacing gut feelings with data-driven insights that improve forecasting accuracy, identify process bottlenecks, and enable strategic resource allocation. By establishing clear metrics, maintaining data quality standards, and creating regular review cadences, organizations build the visibility foundation required for sustainable growth. Whether you're implementing pipeline reporting for the first time or optimizing existing processes, Revio helps HubSpot users design reporting frameworks that actually drive decisions, clean messy data that undermines accuracy, and build automated dashboards that keep stakeholders informed without manual effort.
Put good ideas to work in your business.
We build practical AI systems around your customers, your team and the work that helps your business grow.