HubSpot
Pipeline Velocity: The Revenue Metric That Matters
· 12 min read
Revenue leaders constantly search for metrics that reveal the true health of their sales operations. While traditional measurements like quota attainment and closed-won deals provide backward-looking snapshots, they miss a critical dimension: the speed at which your business generates revenue. Understanding how quickly opportunities flow through your pipeline and convert to closed deals offers predictive power that static metrics simply cannot match. This velocity measurement transforms how sales teams forecast, identify bottlenecks, and optimize their processes for sustainable growth.
What Pipeline Velocity Actually Measures
Pipeline velocity quantifies the speed at which qualified opportunities move through your sales pipeline and convert into revenue. Unlike simple close rates or deal counts, this metric combines multiple performance factors into a single number that represents your revenue generation speed.
The standard pipeline velocity formula incorporates four critical variables:
Number of opportunities in your pipeline
Average deal value across those opportunities
Win rate (percentage of deals that close successfully)
Length of sales cycle (average days from opportunity creation to close)
The calculation itself is straightforward: multiply the number of opportunities by the average deal value and win rate, then divide by the length of your sales cycle. The result tells you how much revenue your pipeline generates per day, week, or month.
Why Traditional Metrics Fall Short
Most revenue teams track pipeline coverage, win rates, and quota attainment separately. This fragmented approach creates blind spots. A team might celebrate a high win rate while ignoring that deals take twice as long to close as they did six months ago. Another team might focus on pipeline volume without recognizing that average deal sizes have declined by 30%.
Pipeline velocity forces you to examine all four levers simultaneously, revealing the compound effect of improvements (or degradation) across multiple dimensions.

The Four Levers That Drive Revenue Speed
Each component of the pipeline velocity equation represents a distinct lever your team can pull to accelerate revenue generation. Understanding how these levers interact helps you prioritize the right improvements at the right time.
Opportunity Volume
The number of qualified opportunities entering your pipeline directly impacts velocity. Double your opportunity flow while holding other variables constant, and you double your velocity. However, quality matters as much as quantity.
Key considerations for opportunity volume:
Lead qualification standards must remain consistent
Marketing and sales alignment on ideal customer profiles
Conversion rates from lead to qualified opportunity
Source attribution to identify highest-velocity channels
Many teams artificially inflate opportunity counts by loosening qualification criteria. This approach backfires quickly, tanking win rates and extending sales cycles as reps chase unqualified prospects.
Average Deal Value
Deal size significantly impacts velocity because it sits in the numerator of the equation. A 20% increase in average deal value produces a 20% velocity increase, assuming other factors remain stable.
Strategy | Impact on Deal Value | Implementation Complexity |
|---|---|---|
Upselling to existing customers | High | Low |
Multi-product bundling | Medium-High | Medium |
Value-based pricing | High | High |
Moving upmarket to enterprise | Very High | Very High |
The relationship between deal size and sales cycle length requires careful attention. Larger deals often take longer to close, which can offset velocity gains if the cycle extends disproportionately.
Win Rate Optimization
Win rate represents efficiency. Improving your win rate by even a few percentage points compounds over time because you generate more revenue from the same pipeline investment.
Common win rate improvement tactics:
Refining ideal customer profile targeting
Implementing qualification frameworks (BANT, MEDDIC, etc.)
Standardizing discovery and demo processes
Competitive battle cards and objection handling
Better sales enablement and training
Many sales organizations discover that 20% of their pipeline consists of deals that should never have been created. Removing these low-probability opportunities actually increases velocity by allowing reps to focus on winnable deals.
Sales Cycle Length
Sales cycle length sits in the denominator, meaning reductions create exponential velocity gains. Cutting your sales cycle from 60 days to 45 days increases velocity by 33%, even if nothing else changes.
This lever often provides the fastest returns because it doesn't require generating more leads or closing larger deals. Instead, it demands process optimization and bottleneck elimination.
Calculating and Tracking Your Velocity
Accurate measurement requires clean data and consistent definitions. Most CRM platforms can calculate pipeline velocity, but the quality of your insights depends entirely on data hygiene and process adherence.
Setting Up the Calculation in HubSpot
HubSpot's native reporting capabilities make pipeline velocity tracking straightforward once your data foundation is solid. Start by ensuring these elements are properly configured:
Deal stages map to your actual sales process
Pipeline creation dates are automatically captured
Close dates are consistently entered
Deal amounts are required fields validated for accuracy
Win/loss reasons are tracked for closed deals
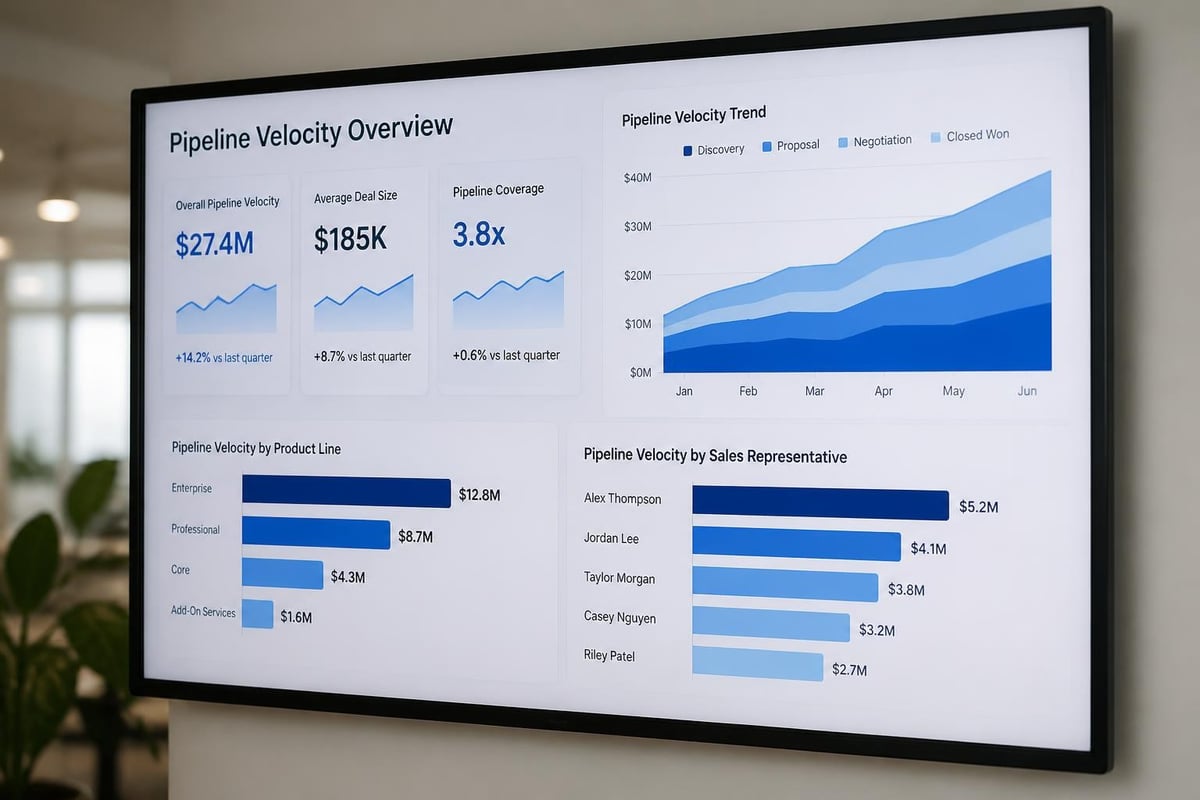
For teams working with complex pipelines or multiple business units, building custom reports that segment velocity by product line, region, or deal type reveals where specific bottlenecks exist.
Frequency and Benchmarking
Track pipeline velocity on a monthly or quarterly basis to identify trends without getting lost in daily noise. Week-to-week fluctuations rarely provide actionable insights, while annual reviews happen too infrequently to drive timely course corrections.
Industry benchmark ranges for B2B SaaS companies:
Company Segment | Typical Velocity (Monthly) | Sales Cycle Length |
|---|---|---|
SMB | $50K - $150K | 30-45 days |
Mid-Market | $200K - $500K | 45-75 days |
Enterprise | $400K - $1.2M | 90-180 days |
These benchmarks vary significantly by industry, average contract value, and go-to-market strategy. Your specific velocity targets should be established based on historical performance and growth objectives.
Diagnosing Velocity Problems
Low or declining pipeline velocity signals specific problems in your revenue engine. The four-component structure provides a diagnostic framework that points directly to the underlying issue.
Velocity Declining Despite Pipeline Growth
When opportunity count increases but velocity stagnates or drops, you're likely experiencing quality degradation. More opportunities entering the pipeline with lower win rates or smaller deal sizes dilutes overall velocity.
Common root causes:
Lead generation prioritizing volume over fit
Inadequate lead scoring and qualification
Sales reps creating opportunities too early in the buyer journey
Marketing channel mix shifting toward lower-intent sources
This scenario often emerges when sales and marketing operate with misaligned incentives. Marketing gets measured on lead volume, sales on pipeline creation, and neither focuses on qualified opportunity quality.
High Win Rates But Low Velocity
Teams with strong win rates but disappointing velocity typically face sales cycle challenges. Deals close successfully but take too long, limiting overall throughput.
Process bottlenecks cause most extended sales cycles:
Excessive stakeholder requirements in approvals
Legal and procurement review delays
Technical validation and security assessment steps
Custom pricing or contract negotiation complexity
Internal resource constraints (presales, solutions engineering)
For organizations dealing with extended enterprise sales cycles, building a sales process that addresses common stalling points directly impacts velocity without requiring fundamental changes to deal economics.
Strong Cycle Times But Weak Velocity
Fast-moving deals that produce low velocity point to problems with opportunity volume or deal value. Either not enough qualified deals are entering the pipeline, or the deals that do enter are too small to drive meaningful revenue.
This pattern frequently appears in organizations transitioning market segments or launching new products. Historical velocity metrics may not apply, and team capacity might be allocated to the wrong activities.
Operational Strategies to Accelerate Velocity
Improving pipeline velocity requires systematic changes across people, process, and technology. The highest-impact improvements address the specific lever constraining your current performance.
Automation and Workflow Optimization
Manual handoffs and administrative tasks slow deals at every stage. Automation eliminates friction points and ensures consistent execution of best practices.
High-impact automation opportunities:
Automatic lead routing based on territory, product, or company size
Triggered follow-up sequences for stalled opportunities
Meeting scheduling and confirmation workflows
Proposal generation and approval routing
Contract management and e-signature processes
Teams working with HubSpot can leverage AI implementation to automate data enrichment, lead scoring, and next-best-action recommendations that keep deals moving forward.
Data Quality and CRM Hygiene
Poor data quality destroys velocity measurement accuracy and slows actual deal progression. Incomplete contact information, outdated company data, and missing stakeholder details force reps to waste time on manual research instead of selling.
Establishing data quality standards requires:
Required fields for deal progression between stages
Automated enrichment for company and contact data
Regular deduplication and cleanup processes
Role-based permissions preventing accidental deletions
Activity logging requirements tied to opportunity updates
Organizations serious about velocity measurement often discover that implementing data governance standards produces immediate improvements simply by surfacing previously hidden bottlenecks.
Sales and Marketing Alignment
Misalignment between sales and marketing teams creates velocity drags at the top of the funnel. When marketing generates leads that sales considers unqualified, opportunities get created, languish, and eventually close as lost-dragging down win rates and extending average cycle times.
A formal service level agreement (SLA) between teams should define:
What constitutes a marketing qualified lead (MQL)
Expected response times for new lead follow-up
Lead recycling rules for nurturing not-yet-ready prospects
Feedback loops on lead quality and conversion rates
Shared accountability for pipeline velocity targets
Advanced Velocity Metrics and Segmentation
Once you've established baseline pipeline velocity tracking, advanced segmentation reveals opportunities that aggregate metrics obscure. Different deal types, products, and customer segments often exhibit dramatically different velocity profiles.
Velocity by Deal Source
Tracking velocity by lead source identifies which marketing and sales channels produce the fastest-moving, highest-value opportunities. A channel generating high opportunity volume with low velocity may need qualification refinement rather than increased investment.
Lead Source | Avg Deal Value | Win Rate | Cycle Length | Monthly Velocity |
|---|---|---|---|---|
Inbound Demo Requests | $45,000 | 32% | 42 days | $343K |
Partner Referrals | $62,000 | 48% | 38 days | $475K |
Outbound SDR | $38,000 | 18% | 51 days | $134K |
Trade Show Leads | $51,000 | 24% | 67 days | $183K |
This analysis often reveals that highest-volume sources don't produce highest-velocity revenue, prompting strategic reallocation of go-to-market resources.

Cohort-Based Velocity Analysis
Analyzing velocity by opportunity creation cohort (monthly or quarterly groups) reveals whether process changes or market conditions are improving or degrading performance over time. A declining velocity trend across successive cohorts signals systematic problems requiring immediate attention.
Cohort analysis also helps account for seasonality and economic factors. Comparing Q4 2026 velocity to Q4 2025 provides more meaningful insights than comparing Q4 2026 to Q1 2026 when seasonal buying patterns differ significantly.
Velocity as a Forecasting Tool
Pipeline velocity transforms from a diagnostic metric into a predictive forecasting tool when tracked consistently. Understanding your velocity trends enables more accurate revenue projections than traditional pipeline coverage models.
Building Velocity-Based Forecasts
Traditional forecasting multiplies pipeline value by expected win rates to project future revenue. This approach ignores timing entirely, creating accuracy problems when sales cycles fluctuate.
Velocity-based forecasting incorporates time directly into the equation:
Monthly Revenue Projection = Current Pipeline Velocity × Forecasting Period
If your current monthly velocity is $400,000, you can project $1.2M in quarterly revenue assuming velocity remains stable. More sophisticated models adjust for known seasonality, planned marketing campaigns, and sales capacity changes.
Leading vs. Lagging Indicators
Pipeline velocity serves as a leading indicator of future revenue performance. Changes in velocity typically precede changes in closed revenue by your average sales cycle length.
A 20% velocity decline today forecasts a similar revenue decline 60-90 days from now (assuming a 60-90 day sales cycle). This early warning system gives leadership time to intervene before revenue misses materialize.
Technology and Integration Considerations
Measuring and improving pipeline velocity requires technology infrastructure that captures accurate data and surfaces actionable insights. For teams using HubSpot, proper configuration and integration strategy directly impact velocity tracking capabilities.
CRM Configuration for Velocity Tracking
Your CRM must accurately timestamp key pipeline events to calculate velocity correctly. Essential data points include:
Opportunity creation date
Date of first sales activity
Dates when deals progress between stages
Close date (won or lost)
Deal amount at each stage transition
For businesses managing complex integrations between HubSpot and other business systems, HubSpot Integrations that maintain data synchronization ensure velocity calculations reflect the complete customer journey across multiple platforms.
Reporting and Dashboard Design
Effective velocity dashboards present current performance alongside historical trends and segment breakdowns. Reports should answer specific questions:
Is our overall velocity increasing or decreasing?
Which pipeline segments are accelerating or decelerating?
What specific opportunities are stalled and need intervention?
How does current performance compare to quarterly targets?
Real-time visibility into these metrics enables proactive pipeline management rather than reactive problem-solving after deals are already lost.
Connecting Velocity to Revenue Operations
Pipeline velocity sits at the intersection of sales effectiveness, marketing efficiency, and operational excellence. Revenue operations (RevOps) teams use velocity as a north star metric that aligns cross-functional initiatives toward a common goal: faster, more predictable revenue generation.
Cross-Functional Velocity Improvement
Improving velocity requires coordinated action across multiple teams:
Marketing contributions:
Higher-quality lead generation through better targeting
Content that accelerates buyer education and readiness
Account-based marketing for key target accounts
Sales contributions:
Consistent qualification and pipeline hygiene
Standardized discovery and value demonstration
Proactive deal management and stakeholder engagement
Operations contributions:
Process automation reducing administrative burden
Data quality ensuring accurate reporting and insights
Integration management connecting disparate systems
Organizations that treat velocity as a shared objective rather than solely a sales metric achieve sustainable improvements because they address systemic constraints rather than just coaching individual rep performance.
Building a Velocity-Focused Culture
Cultural changes often prove more impactful than tactical process tweaks. Sales teams that internalize velocity thinking make different daily decisions about time allocation, opportunity qualification, and deal prioritization.
Regular pipeline reviews should incorporate velocity analysis alongside traditional funnel metrics. Questions to ask during these reviews include:
Which deals have been in the same stage for longer than our average cycle?
What bottlenecks are we seeing repeatedly across multiple opportunities?
Are we pursuing opportunities outside our ideal customer profile?
What resources or support would accelerate our highest-value deals?
When reps understand that pipeline quality and deal speed matter as much as volume, behavior shifts toward activities that truly drive velocity rather than merely inflating pipeline numbers.
Mastering pipeline velocity measurement and optimization transforms how revenue teams forecast, prioritize, and execute. By focusing on the four key drivers-opportunity volume, deal value, win rate, and cycle length-organizations gain a comprehensive view of revenue generation speed and the specific levers available to accelerate it. Whether you're struggling with extended sales cycles, inconsistent win rates, or unreliable forecasts, velocity metrics provide the diagnostic clarity needed to drive meaningful improvement. Revio helps businesses implement the CRM infrastructure, automation, and reporting frameworks necessary to track and improve pipeline velocity consistently, turning this powerful metric into a competitive advantage that drives sustainable revenue growth.
One clear next move
Build the system your team needs to grow.
Tell us which tools you use, where work is breaking and what growth is asking the team to do next. We will show you the right platform, system design and level of ongoing support.
Choose the toolsConfirm the platforms and licenses your teams actually need.
Build the systemDesign the process, data, automation, integrations and reporting around the work.
Keep it growingDecide what Revio should manage after launch.